Betekenis van het woord "bubble chart" in het Nederlands
Wat betekent "bubble chart" in het Engels? Ontdek de betekenis, uitspraak en specifiek gebruik van dit woord met Lingoland
bubble chart
US /ˈbʌb.əl tʃɑːrt/
UK /ˈbʌb.əl tʃɑːt/
Zelfstandig Naamwoord
bellengrafiek
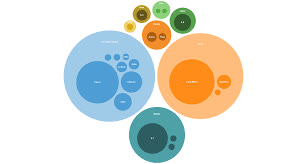
a type of chart that displays three dimensions of data, where each data point is represented by a bubble whose size indicates the third value
Voorbeeld:
•
The marketing team used a bubble chart to compare market share, growth rate, and total revenue.
Het marketingteam gebruikte een bellengrafiek om marktaandeel, groeipercentage en totale omzet te vergelijken.
•
In a bubble chart, the area of the circle represents the magnitude of the data point.
In een bellengrafiek vertegenwoordigt de oppervlakte van de cirkel de grootte van het datapunt.